AI-generated image
Contents
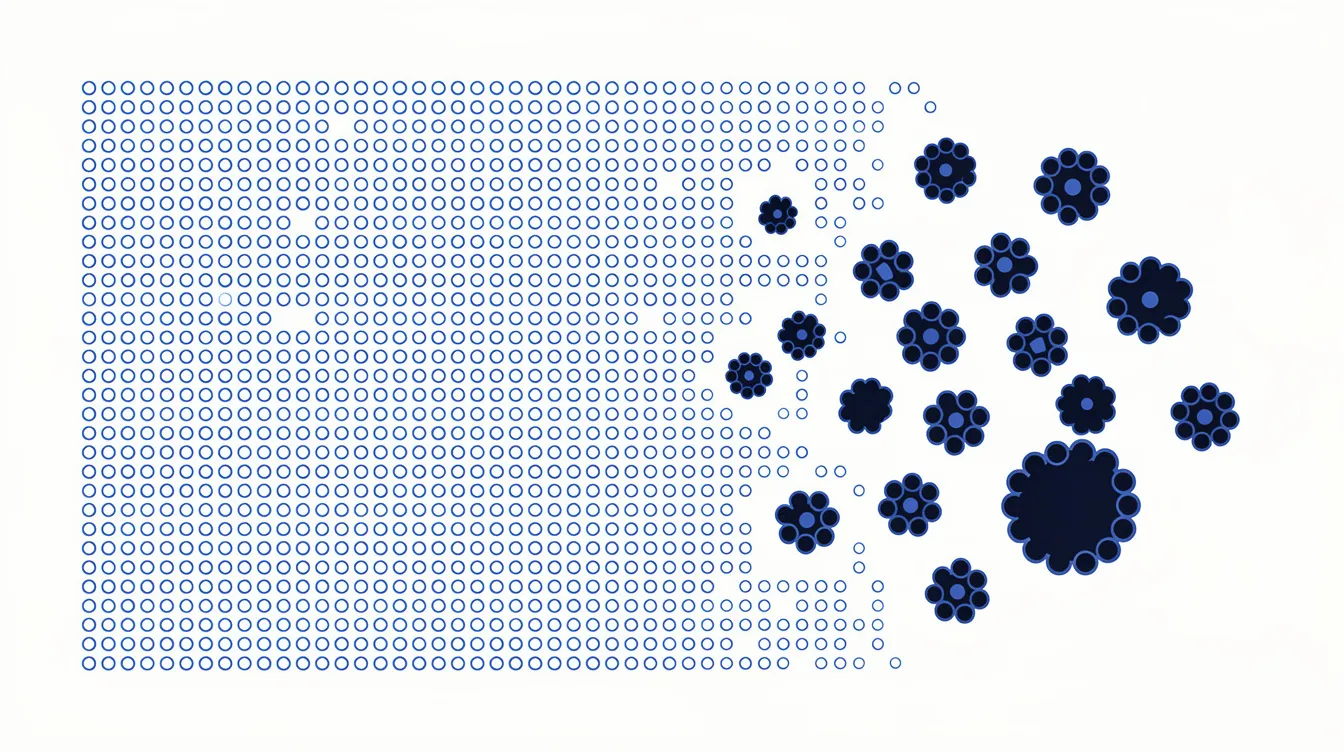
A field force running at four reps to every patch that two could hold is not overstaffed. It is mis-structured. Rebalancing one such territory from a 4:1 ratio to 2:1 added no headcount and cut no calls from the plan. It recovered the coverage that overlap had been quietly burning.
That is the part most territory reviews miss. When results disappoint, the instinct is to manage the reps: more coaching, tighter targets, a new incentive curve. But when four people are working a stretch of the map that two could cover properly, no amount of rep-level effort fixes it. The reps are doing their jobs. The map is the problem.
How the imbalance hides
Most territory maps are inherited, not designed. They grow by accident: a patch is split when someone is hired, merged when someone leaves, redrawn around who happens to live where. Over a few years the lines stop matching the market underneath them.
The result is overlap nobody planned. Two reps drive past each other to reach customers on the far side of their patch. Three call on the same cluster of high-value pharmacies while a quieter zone two towns over sees a rep once a quarter. Everyone is busy. Coverage still has holes. And because the imbalance is spread across the whole map, no single rep’s numbers look wrong enough to explain it.
You cannot see it from call reports, because call reports only show where reps went, not where they should have. You can only see it when you put the territory map back on top of a governed picture of the market.
What the rebalance actually did
The fix was not a reorganisation. It was a measurement.
We rebuilt the territory against governed analysis zones rather than legacy boundaries: 1,360 zones covering South Africa on the zone model current at delivery (the current model runs 1,054 zones on the 2026 ward vintage), every pharmacy in it source-attributed rather than rep-reported. With the real distribution of dispensing points laid out zone by zone, the overlap was no longer a suspicion. It was a map you could point at.
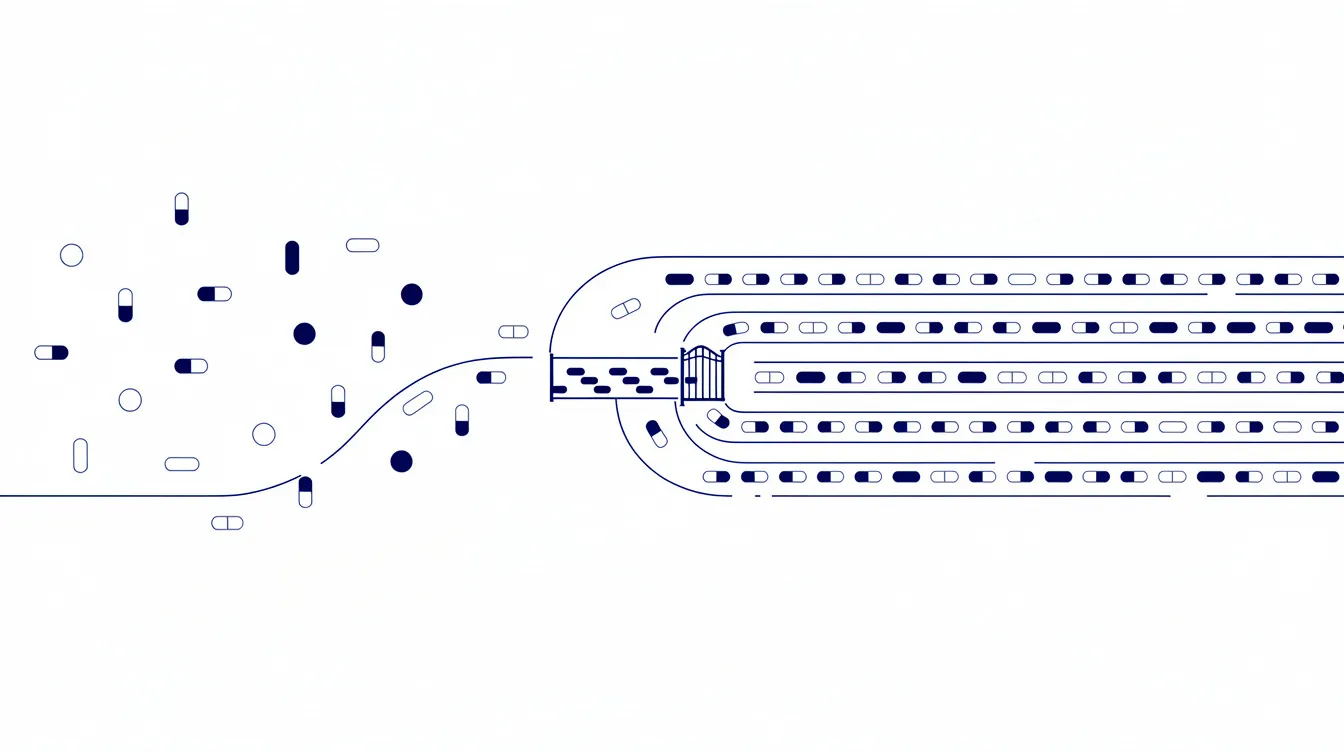
From there the rebalance was arithmetic, not argument. The stretch carrying four reps for the work of two was thinned to a 2:1 ratio. The freed capacity went to the zones that had been seeing a rep a handful of times a year. Same team. Same calendar. A coverage model that finally matched the ground it was drawn on.
Why governed data is the whole game here
A territory rebalance is only as honest as the market picture underneath it. Redraw lines on rep-reported data and you simply formalise the same blind spots in cleaner shapes.
That is the difference governed data makes. When every zone traces to disclosed official sources, two people looking at the same territory reach the same conclusion, and the rebalance survives the first hard question from a regional or global head office. It is the same discipline that runs through the Herbst Conductor framework, where the field force is only ever as good as the brief it is handed, and the brief is only as good as the data behind it.
Decades of work in scheme design taught us the cheap version of this lesson: a sales structure built on an estimate inherits the estimate’s errors and compounds them every quarter.
See your own map
The distribution most field forces are deployed against is already public. The SA Pharmacy Coverage Benchmark sets out the governed national picture: 1,054 governed zones, 5,200+ pharmacies, every input source-attributed with a recorded legal basis.
If you want to see where your own territories sit against it, the DiaDoc diagnostic walks through your coverage in those same governed zones, so you can find the 4:1 stretches before they cost you another quarter.

Written by
Dieter Herbst
CEO at Herbst Group. Working with pharmaceutical commercial leaders across South Africa, Kenya, and Brazil to transform sales force effectiveness through evidence-based approaches.
Connect on LinkedIn