Aerial view of South African landscape with geometric data overlay
Geographic Intelligence Initiative

What if every address in South Africa could tell you a story?

Not just where. Who lives there. What healthcare serves them. What risks surround them. What opportunity waits. Her-Zone is a geographic intelligence framework built in South Africa, for South Africa. Indigenous, accurate, and infinitely extensible.

South African neighbourhood at dusk with warm porch lights

What if every address in South Africa could tell you a story?

A story not just of where, but of who. Of how many people live there, what healthcare infrastructure serves them, what disease burden they carry, and what opportunities exist to improve their lives.

We asked that question. Then we built the answer.

Her-Zone divides South Africa into operational zones. Each zone carries layers of intelligence drawn from government open data, international health surveillance, satellite earth observation, and commercial healthcare records. The result is a living map. Not a static one. A map that learns.

We built it because South Africa deserves better maps. Better data. Better decisions.

And we believe the best way to prove that is to share it.

— Dieter Herbst, Founder

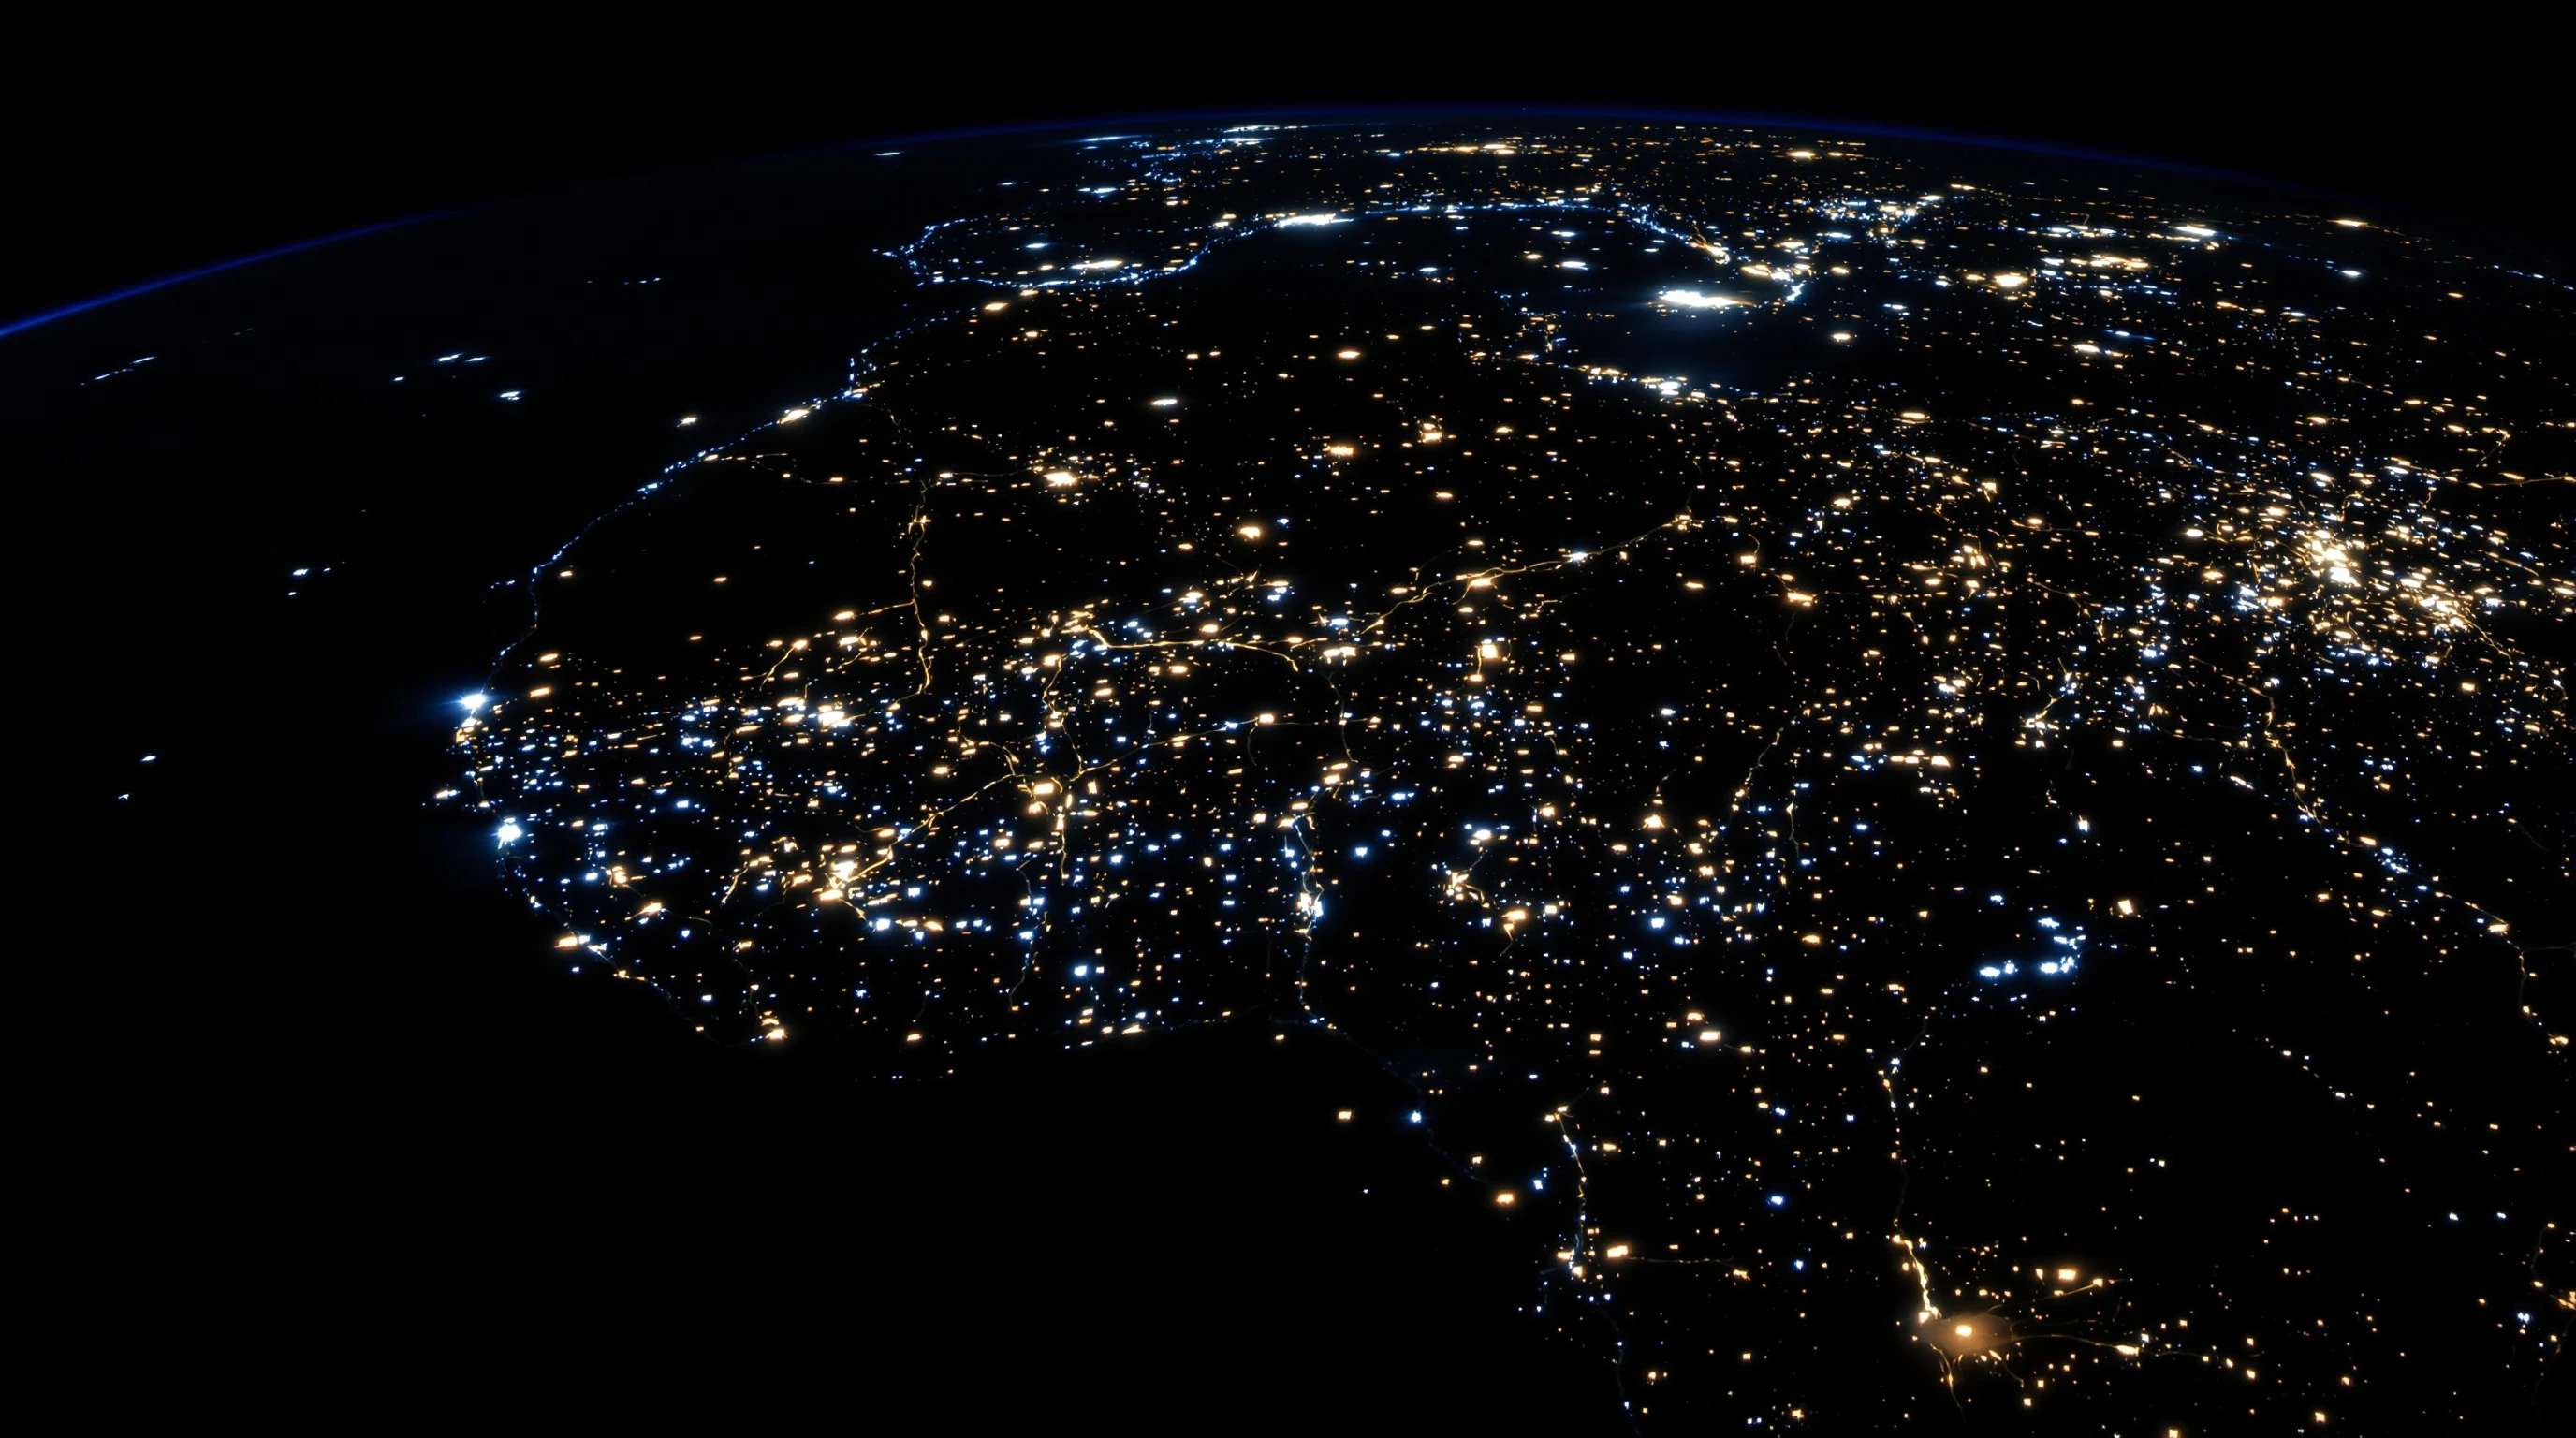
South Africa has some of the richest public data in Africa. Census data. Health facility registers. Crime statistics. Disease surveillance. Satellite imagery. It exists.

The problem is not data. The problem is geography.

Traditional maps serve traditional economies. They assume infrastructure. They assume formal addressing. They assume that a postal code means something. In South Africa, it often does not. A single postal code can contain a suburb and an informal settlement. A clinic and a wholesaler fifty kilometres apart.

Her-Zone fixes that.

We built a geographic framework from the ground up. Every zone is sized for operational reality. Every data layer is stitched to that framework. The address is the starting point. The zone is the smallest denominator. The intelligence follows.

Abstract network of interconnected data nodes

Six intelligence domains. One framework.

Healthcare Infrastructure

Hospitals, clinics, pharmacies, laboratories, dispensing doctors. Healthcare professional workload mapping. Water quality scoring by zone. The full picture of who provides care, where, and under what conditions.

Disease Surveillance

Antimicrobial resistance patterns. Wastewater pathogen monitoring. Influenza tracking. Vaccination gap analysis. Early warning signals drawn from national and international health surveillance networks.

Public Safety

Crime statistics at precinct level. Safety indices by zone. The context that determines whether a facility is accessible, whether a delivery route is viable, whether a community is underserved by more than just healthcare.

Demographics

Population. Employment. Education. Income. Infrastructure access. The human story behind the geography. Drawn from national census and municipal data.

Predictive Analytics

Baselines built from historical data. Forecasting models that project forward. Trajectory analysis that shows where a zone is heading. Opportunity scoring that highlights where intervention will have the greatest impact.

Market Intelligence

Pharmaceutical distribution patterns. Commercial opportunity mapping. Competitor positioning. The layer that turns geographic intelligence into commercial strategy.

Earth from orbit at night showing southern Africa illuminated by city lights

We measure economic activity from orbit.

NASA's VIIRS satellite captures light radiance across the earth's surface every night. Peer-reviewed research published in the American Economic Review established that night-time light intensity is a reliable proxy for economic activity.

Her-Zone integrates five years of this satellite data. Every zone in South Africa carries a radiance score. Over time, those scores reveal trajectories. Growth. Decline. Stability. Seasonal patterns. The kind of economic signal that no survey can capture at this scale.

The raw data is public domain, produced by NASA. The processed composites are licensed CC BY 4.0 by the Earth Observation Group at the Payne Institute, Colorado School of Mines. The integration at zone level is Herbst Group intellectual property.

South Africa's first commercial deployment of satellite economic intelligence at sub-municipal resolution.

Not a map of where the lights are. A map of where the economy moves.

Three monumental architectural columns at golden hour

Three pillars. One framework.

The Core Engine

Every query starts with a location. The location resolves to a smallest denominator. The smallest denominator maps to a zone. From there, every data layer is accessible. No manual lookup. No cross-referencing spreadsheets. One location. One answer.

Multi-Function

The same framework serves sales planning, marketing targeting, logistics routing, and operational deployment. One geographic truth. Four functions. No duplication. No conflicting boundaries.

Multi-Domain

Healthcare infrastructure today. Disease surveillance tomorrow. Public safety next week. Demographics next month. The framework does not care what data you attach to it. It cares that the geography is right. Build once. Extend forever.

Built on trust. Governed by principle.

ISO 27001

Working toward certification

Continuous security monitoring. Information security management built into the platform from day one, not bolted on after.

POPIA

By Design

Zone-level aggregation by design. Where individual facility data is stored, it is sourced from public statutory registers in accordance with POPIA. Privacy is structural, not policy.

Creative Commons

CC BY 4.0

The Her-Zone geographic foundation is released under Creative Commons Attribution 4.0 International. Intelligence and enterprise layers are available under licence.

Data Provenance

Built from authoritative sources. Government open data. International health surveillance. Satellite earth observation. Commercial healthcare intelligence. Every source documented. Every transformation auditable. Designed for full traceability from zone to source.

Modern Johannesburg boardroom with city skyline through windows

Access is not a pricing page. It is a philosophy.

Foundation

Creative Commons BY 4.0
  • Zone boundaries and correspondence tables
  • Census demographics
  • School locations
  • Municipal finance indicators
  • Water quality scores

Empowerment

Licensed. Subsidised.
  • Everything in Foundation
  • Disease surveillance data
  • Safety indices
  • Satellite economic activity scoring

Enterprise

Licensed.
  • Everything in Foundation and Empowerment
  • Healthcare facility networks
  • Pharmaceutical distribution intelligence
  • Predictive baselines and forecasting
  • Market intelligence and opportunity scoring

The conversation starts the same way for everyone: what are you trying to build?

Who this is for

Healthcare

We cannot see which zones are underserved.

Her-Zone shows you. Healthcare infrastructure, disease burden, and facility workload. By zone. Updated.

Government

We plan services on outdated boundaries.

Her-Zone gives you operational zones built for South African reality. Demographics, safety, infrastructure access. One framework for planning, monitoring, and allocation.

Financial Services

We assess risk on postal codes that mean nothing.

Her-Zone replaces postal codes with zones that carry economic activity data, demographic profiles, and infrastructure scores. Risk assessment grounded in reality.

Consumer and FMCG

We deploy field teams on territory maps drawn ten years ago.

Her-Zone gives you zones sized for operational execution. Market intelligence, distribution patterns, and opportunity scoring. Current. Granular. Actionable.

Flu Season Intelligence

Eleven years of sentinel surveillance. Every zone scored. Every season mapped.

11
Years of Data

National flu season coverage from 2014 to 2024, including the COVID-disrupted seasons of 2020-2021. Built from WHO FluNet sentinel surveillance data contributed by the NICD.

11
Vulnerability Factors

Every zone carries a flu vulnerability score derived from elderly population share, child density, HIV prevalence, climate suitability, healthcare access, pharmacy density, vaccination gaps, and historical burden.

WHO MEM
Season Thresholds

Season onset and end dates use the WHO Moving Epidemic Method, the international standard for flu threshold calculation. Both fixed and MEM-derived thresholds are published for every season.

9
Provinces Covered

Province-level sentinel surveillance data from NICD reporting sites. Weekly positivity rates, strain dominance tracking (H1N1, H3N2, Victoria, Yamagata), and severity indices.

Open Data for Public Health

Flu season timing, weekly positivity rates, and province-level vulnerability data are freely available as CSV downloads for public health research. Full methodology documentation is published with every dataset.

Source: World Health Organization FluNet, Global Influenza Surveillance and Response System (GISRS). Data based on sentinel surveillance conducted by the National Institute for Communicable Diseases (NICD), South Africa. Additional data from NICD annual influenza surveillance reports, Open-Meteo Historical Weather API, and the Human Sciences Research Council (HSRC) SABSSM V survey.

Methodology: Flu Intelligence Methodology Appendix | WHO FluNet data licensed under CC BY-NC-SA 3.0 | Open-Meteo data licensed under CC BY 4.0

Modern South African hospital entrance at sunrise

This is an invitation to explore. To question. To imagine.

Her-Zone is not finished. It will never be finished. Every new data source, every new zone refinement, every new domain makes it sharper. That is by design.

We are not selling you a product. We are inviting you into a conversation. Tell us what you are working on. Tell us what geography fails you. Tell us what decisions you would make differently if the data existed.

We will listen. And then we will show you what we have built.

What would you do differently if every address told you a story?

— Dieter Herbst, Founder

The Her-Zone geographic foundation is released under Creative Commons Attribution 4.0 International. Intelligence and enterprise layers are available under licence.

Her-Zone™ is developed by Herbst Group (Pty) Ltd